Capacitance-Voltage (C-V) Measurement
Capacitance-voltage (C-V) measurement sweeps a DC voltage across a structure such as a metal-oxide-semiconductor (MOS) capacitor while measuring its capacitance with a small AC signal. The shape of the resulting C-V curve reveals the gate insulator thickness, the semiconductor doping, and charges and defects in the insulator and at its interface.
Also called: C-V measurement, CV profiling, MOS C-V
Diagram
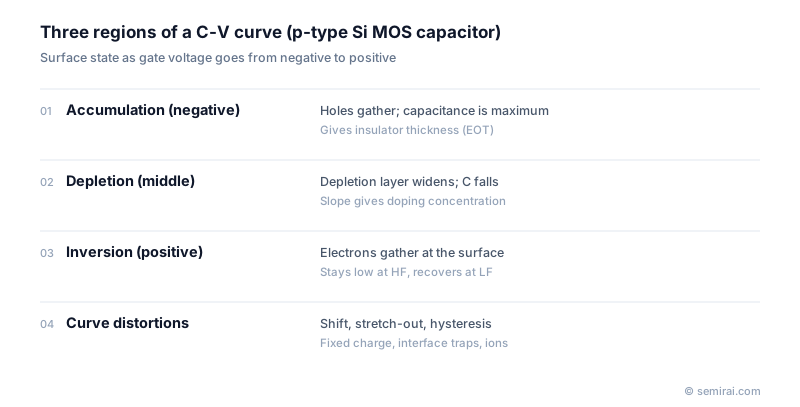
The three regions of a C-V curve
Take a MOS capacitor on p-type silicon. A negative gate voltage attracts holes to the surface: this is accumulation, and the capacitance is close to that of the oxide alone, the maximum. As the voltage moves positive, holes are pushed away and a depletion layer forms and widens, adding a capacitance in series and lowering the total.
At still higher voltage, electrons gather at the surface and form an inversion layer. Whether the capacitance then recovers depends on the measurement frequency: at low frequency the inversion charge can follow the signal and the capacitance returns towards the oxide value, while at high frequency it stays low. On n-type substrates the voltage directions are reversed.
What the curve tells you
Accumulation capacitance gives the insulator thickness, expressed as equivalent oxide thickness (EOT) for high-k films. The voltage where the curve rises gives the flat-band voltage, and the slope in depletion gives the doping concentration.
Departures from the ideal curve are equally informative. A sideways shift indicates fixed charge in the insulator, a stretched-out curve indicates interface traps, and hysteresis between forward and reverse sweeps indicates mobile ions or charge trapping. C-V is essential in developing high-k gate stacks and SiC gate oxides and in monitoring processes with test structures on production wafers.
FAQ
Why does the measurement frequency matter?
Minority carriers in the inversion layer and charges in interface traps take time to respond. At high frequencies, often 1 MHz, they cannot follow the signal; at low or quasi-static frequencies they can. Comparing high- and low-frequency curves is a classic way to estimate interface trap density.
What can go wrong with C-V on very thin oxides?
Very thin insulators leak current, which distorts the measured capacitance, and series resistance in the substrate or contacts adds error. Analysts use smaller test structures, correct for leakage and series resistance with circuit models, and account for quantum effects that make the electrical thickness larger than the physical one.
Related pages
Sources
Last updated: November 13, 2026