Energy Dispersive X-ray Spectroscopy (EDX / EDS)
Energy dispersive X-ray spectroscopy (EDX or EDS) identifies and measures elements by detecting the characteristic X-rays a sample emits when struck by an electron beam. The detector is normally attached to a scanning or transmission electron microscope, so the exact spot seen in the image can be analysed. That direct link between image and composition is its main strength.
Also called: EDX, EDS, EDXS, energy-dispersive X-ray analysis
Diagram
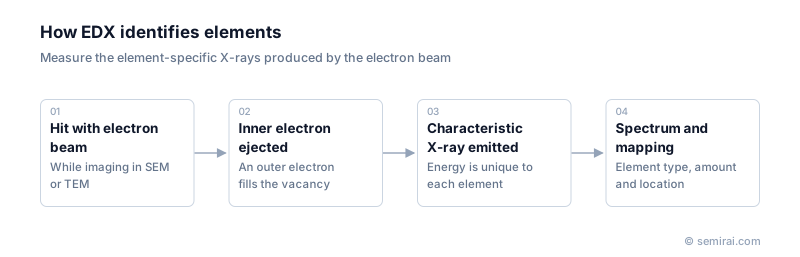
How EDX works
The electron beam knocks inner-shell electrons out of atoms in the sample. Electrons from outer shells fall into the vacancies and release the energy difference as X-rays. Each element emits X-rays at its own set of energies, so a spectrum of X-ray energy versus counts shows which elements are present, and peak heights indicate how much.
A semiconductor detector, today usually a silicon drift detector, records the energy of each X-ray photon. Scanning the beam across an area while collecting spectra produces elemental maps, colour-coded images showing where each element is located.
Uses and limits
In fabs and failure analysis laboratories, EDX identifies the elements in particles found on wafers, which points to their source, such as a chamber part or a chemical. On cross-sections of failed chips it shows how wiring and film materials are distributed and reveals corrosion, diffusion and voids. In a TEM with a thin sample, EDX maps reach nanometre resolution.
EDX is quick but has clear limits. Sensitivity to light elements is poor, peaks from different elements can overlap, the detection limit is roughly 0.1 weight percent, and it gives no information on chemical bonding. Trace analysis is done with SIMS and chemical state analysis with XPS.
Japanese companies involved
- JEOL makes scanning and transmission electron microscopes along with EDS systems for elemental analysis.
- Hitachi High-Tech's SEMs and FIB-SEMs are commonly fitted with EDX detectors for particle and failure analysis.
- JEOL · Electron beam lithography systems, electron microscopes and surface analysis
- Hitachi High-Tech · CD-SEM metrology, defect inspection and etch systems
FAQ
What is the difference between EDX and WDX?
Wavelength dispersive X-ray spectroscopy (WDX or WDS) separates X-rays with diffracting crystals before counting them. It resolves overlapping peaks and detects lower concentrations than EDX, but it is slower and collects one element at a time. Electron probe microanalysers use WDX for precise quantitative work.
How deep does an SEM-EDX analysis reach?
X-rays come from the whole volume the beam spreads into, typically around a micrometre deep at common SEM voltages. A small particle or thin film therefore gives a spectrum mixed with signal from the material beneath, which must be considered when interpreting results.
Comparisons
Related pages
Sources
Last updated: November 13, 2026