Process Capability Index (Cp, Cpk)
A process capability index expresses how comfortably a stable process produces output within its specification limits. Cp compares the width of the specification with the spread of the process, measured by its standard deviation σ. Cpk also accounts for how far the process mean sits from the centre of the specification. Fabs calculate them for parameters such as film thickness, line width and resistance.
Also called: Cp, Cpk, process capability
Diagram
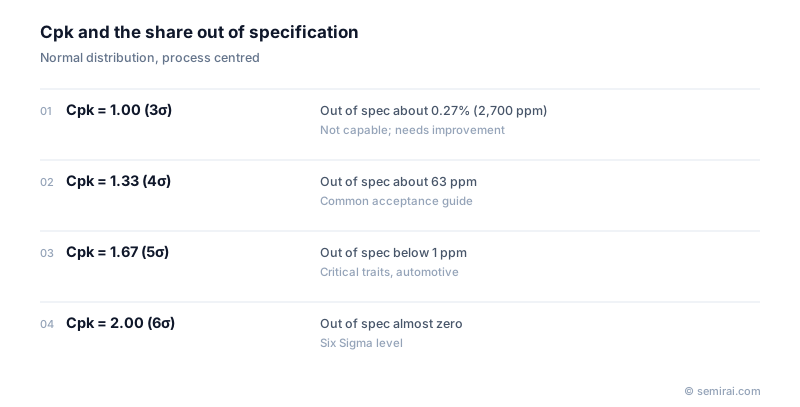
How Cp and Cpk are calculated
Cp = (USL − LSL) / 6σ, where USL and LSL are the upper and lower specification limits. It grows as variation shrinks but ignores where the process is centred. Cpk = min(USL − mean, mean − LSL) / 3σ uses the distance to the nearer limit, so it is lower than Cp whenever the mean is off-centre and equals Cp only when the process is perfectly centred.
For a centred, normally distributed process, Cpk = 1.0 means about 0.27% (2,700 ppm) of output falls outside specification. At 1.33 this drops to about 63 ppm, and at 1.67 to below 1 ppm. A Cpk of at least 1.33 is a common rule of thumb for an acceptable process, and products with strict quality needs, such as automotive chips, often require higher values.
Assumptions to check first
The indices assume that the data are roughly normal and that the process is stable. Engineers first confirm stability on a control chart; an unstable process has no meaningful capability. They also confirm with a gage R&R study that measurement variation is small, since noisy measurements inflate σ and understate capability.
Indices calculated from short-term data within a subgroup are often reported as Cp and Cpk, and those from long-term overall data as Pp and Ppk. The long-term figures are usually lower because they include drift between lots.
FAQ
What if a parameter has only one specification limit?
For one-sided limits, such as a maximum leakage current or a minimum breakdown voltage, Cp is undefined and only the relevant half of Cpk is used: (USL − mean) / 3σ or (mean − LSL) / 3σ.
What if the data are not normally distributed?
Many semiconductor parameters, such as defect counts or leakage, are skewed. Applying normal-based formulas then misstates the out-of-specification rate. Engineers transform the data, fit a suitable distribution, or use percentile-based capability methods instead.
Related pages
- Statistical Process Control (SPC)
- Process Control
- Uniformity (Within-Wafer and Wafer-to-Wafer)
- Yield
- Gage R&R (Gauge Repeatability and Reproducibility)
- Advanced Process Control (APC)
- DPPM (Defective Parts Per Million)
- Yield management systems (YMS)
- Advantest ACS Gemini Digital Twin Software Solution
- Advantest ACS RTDI™
- Toray Engineering NDAS
Sources
Last updated: November 13, 2026