Statistical Process Control (SPC)
Statistical process control (SPC) is a quality method that tracks process measurements over time and uses statistics to decide whether a process is stable or has changed. In semiconductor fabs, SPC watches values such as critical dimension, film thickness and overlay on control charts and raises an alarm before drift turns into scrapped wafers.
Also called: SPC, control charts
Diagram
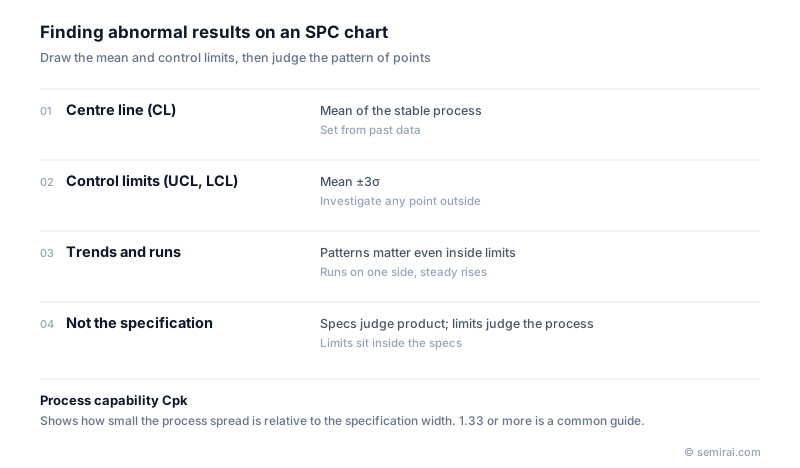
How a control chart works
A Shewhart control chart has a centre line at the process mean and control limits, usually three standard deviations above and below it (UCL and LCL). An X-bar chart tracks the average of each sample and an R or S chart tracks its spread. A point outside the limits suggests a special cause that should be investigated.
Points inside the limits can still signal trouble. Run rules such as the Western Electric and Nelson rules flag patterns like several points in a row on one side of the centre line or a steady upward trend. These patterns often reveal a slow drift, such as a wearing part, before any limit is crossed.
Control limits are not specifications
Specification limits come from the product: they say what is acceptable. Control limits come from the process: they describe its normal variation. A stable process sits well inside the specification, so control limits are normally tighter than specification limits, and a control-limit alarm is an early warning rather than a reject.
The process capability index Cpk compares process spread with the specification width. A Cpk of 1.33 or more is a widely used rule of thumb for a capable process.
SPC in a modern fab
A fab tracks thousands of parameters, many of them correlated. Multivariate SPC watches several parameters together and can catch combined shifts that no single chart shows. SPC alarms also feed advanced process control and engineering holds, so the response is often automatic.
FAQ
Where did SPC come from?
Walter Shewhart developed the control chart at Bell Laboratories in the 1920s. W. Edwards Deming later taught statistical quality methods widely, including in post-war Japanese industry.
What should happen when an SPC chart alarms?
The usual response is defined in advance: hold the affected lot or tool, check the measurement itself, then look for the cause. Many fabs link alarms to an out-of-control action plan so that the response does not depend on who is on shift.
Related pages
Sources
Last updated: November 2, 2026