Uniformity (Within-Wafer and Wafer-to-Wafer)
Uniformity describes how consistently a process result, such as film thickness, etch depth or pattern width, is reproduced across locations and over time. Fabs distinguish within-wafer (WIW) uniformity, wafer-to-wafer (WTW) uniformity and lot-to-lot uniformity. Better uniformity means chips from any part of any wafer behave alike, which stabilises yield.
Also called: WIW uniformity, WTW uniformity, non-uniformity
Diagram
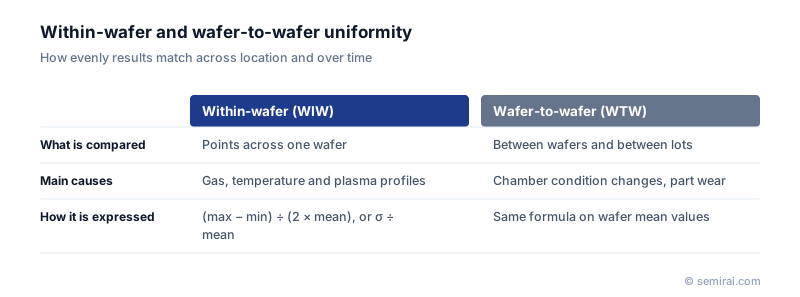
How uniformity is calculated
There is no single formula. A common one is the range method: (maximum − minimum) ÷ (2 × mean) × 100%. Another divides the standard deviation by the mean, quoted as 1σ% or 3σ%. Lower numbers mean better uniformity, and specifications are written in forms such as "film thickness non-uniformity below 1%, 1σ".
The result also depends on how many points are measured and how wide an edge exclusion, the ring at the wafer edge left out of the calculation, is used. Two uniformity figures can only be compared when the formula, sampling plan and edge exclusion match.
What drives non-uniformity
Within-wafer uniformity is set by tool design and recipe. In deposition and etching the main factors are the gas distribution from the showerhead, the temperature profile of the wafer stage and the shape of the plasma, and the difference usually shows up between wafer centre and edge. Tools therefore split heaters and gas injection into zones that can be tuned separately. In chemical mechanical planarization (CMP) the pressure profile of the polishing head plays the same role.
Wafer-to-wafer and lot-to-lot uniformity degrade as chamber walls accumulate deposits, parts wear and consumables are replaced. Fabs track them with inline metrology and statistical process control and correct them with run-to-run advanced process control.
Japanese companies involved
- Tokyo Electron designs its deposition and etch systems with zoned gas and temperature control to tune within-wafer uniformity.
- SCREEN Holdings makes single-wafer cleaning systems, where even chemical and rinse coverage across the wafer is a key design goal.
- Tokyo Electron (TEL) · Coat/develop, etch and deposition equipment
- SCREEN Holdings · Wafer cleaning, coat/develop and inspection equipment
FAQ
Why is the wafer edge usually the worst area?
Gas flow, temperature and plasma conditions change sharply at the edge of the wafer and its holder. Films and etch rates therefore drift near the rim, which is why specifications exclude a few millimetres at the edge and why edge tuning hardware is a major part of tool design.
Is a range-based or sigma-based figure better?
Range-based figures are simple and sensitive to single outliers, which makes them conservative. Sigma-based figures describe the bulk of the distribution better when many points are measured. Many fabs report both, and supplier data sheets should always state which one is used.
Related pages
- Removal Rate (Preston Equation)
- Statistical Process Control (SPC)
- Microloading Effect
- Process Capability Index (Cp, Cpk)
- Gage R&R (Gauge Repeatability and Reproducibility)
- Spin Coating
- Film thickness metrology
- SCREEN Holdings VM-1020
- SCREEN Holdings VM-1200 / VM-1300
- SCREEN Holdings VM-2500 / VM-3500
- Hamamatsu Photonics HyperGauge C17319-11
Sources
Last updated: November 13, 2026