Weibull Distribution
The Weibull distribution is the probability distribution most widely used to describe the spread of lifetimes of products and components. Its cumulative failure fraction is F(t) = 1 − exp[−(t/η)^β], where β is the shape parameter and η is the scale parameter. It was proposed by the Swedish engineer Waloddi Weibull for analysing material strength.
Also called: Weibull plot, Weibull analysis
Diagram
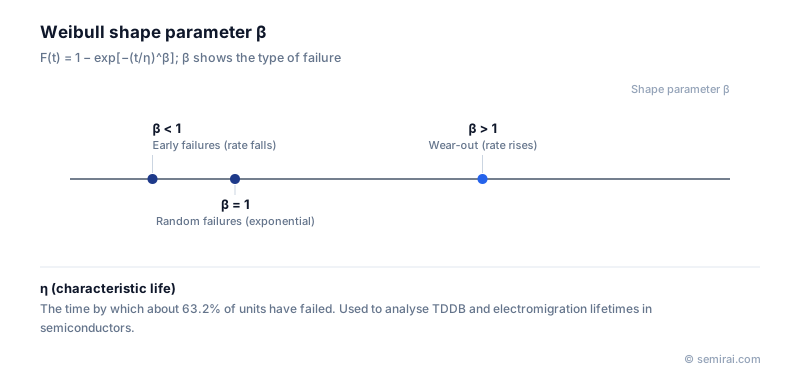
What the parameters mean
The main advantage of the Weibull distribution is that β tells you how failures behave. With β < 1 the failure rate falls over time (early or infant-mortality failures); with β = 1 it is constant (random failures); with β > 1 it rises over time (wear-out). These match the three periods of the bathtub curve.
When β = 1 the Weibull distribution becomes the exponential distribution, and the mean time to failure (MTTF) is the reciprocal of the failure rate λ. The scale parameter η, called the characteristic life, is the time by which about 63.2% of the population has failed, whatever the value of β.
How it is used in semiconductor reliability
Lifetime data for gate-oxide breakdown (time-dependent dielectric breakdown, TDDB), electromigration in interconnects and thermal fatigue of solder joints are commonly analysed with Weibull statistics. Plotted on Weibull probability paper, data that follow the distribution lie on a straight line; its slope gives β and the 63.2% point gives η.
Because tests are run at high stress, the η obtained from an accelerated test is converted to use conditions with an acceleration model, such as the Arrhenius model for temperature, and the result is compared with the target failure rate. A change in slope partway through the data often means that two failure mechanisms are mixed.
Japanese companies involved
- ESPEC makes temperature, humidity and thermal-cycling chambers used to run the accelerated tests whose failure times are analysed with Weibull plots.
- ESPEC · Environmental and reliability test chambers
FAQ
What does the shape parameter β tell you?
It describes how the failure rate changes with time. Values below 1 point to early defects that a screen such as burn-in could remove, a value of 1 to random failures, and values above 1 to wear-out. A large β means failures cluster tightly around the characteristic life.
How is the Weibull distribution related to the exponential distribution?
The exponential distribution is the special case with β = 1, which assumes a constant failure rate. The Weibull distribution generalises it to failure rates that rise or fall with time, which is why it fits wear-out mechanisms that a constant-rate model cannot describe.
Related pages
Sources
Last updated: November 2, 2026