Arrhenius Plot
An Arrhenius plot is a graph of the logarithm of a reaction or degradation rate against the reciprocal of absolute temperature (1/T). If the rate k follows the Arrhenius equation k = A × exp(−Ea/kBT), the plot is a straight line, and its slope gives the activation energy Ea. Here kB is the Boltzmann constant.
Also called: Arrhenius graph
Diagram
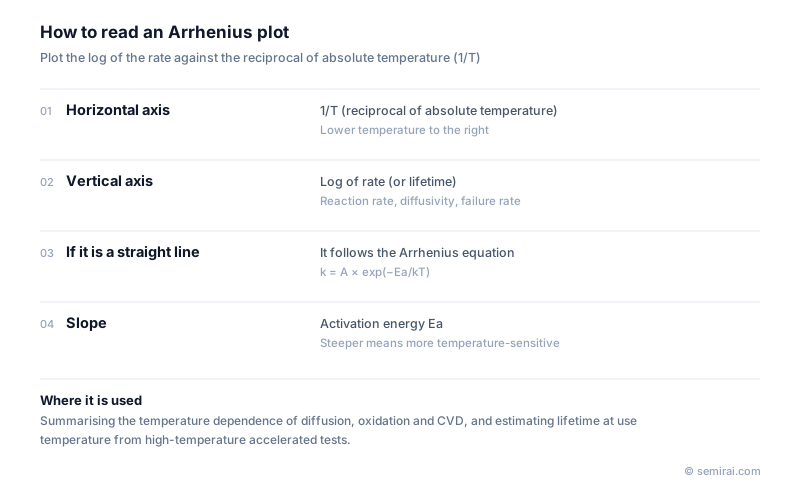
Reading the plot
Taking logarithms of the Arrhenius equation gives ln k = ln A − (Ea/kB) × (1/T), which is a straight line in ln k versus 1/T. The slope equals −Ea/kB, so multiplying it by the Boltzmann constant and reversing the sign gives the activation energy. Low temperatures sit on the right of the horizontal axis.
The activation energy is the height of the energy barrier the process must overcome. It describes temperature sensitivity: the larger it is, the more the rate changes for a small change in temperature, and the steeper the line.
Uses in process engineering
Dopant diffusion coefficients, thermal oxidation rates and CVD deposition rates are all summarised with Arrhenius plots. In chemical vapour deposition (CVD), the low-temperature region is limited by surface reaction and gives a steep line, while the high-temperature region is limited by gas supply and gives a shallow one. The knee where the slope changes shows the temperature at which the limiting mechanism switches.
Uses in reliability testing
Accelerated tests such as high-temperature operating life (HTOL) or electromigration tests are run at several temperatures. Plotting the logarithm of lifetime against 1/T gives the activation energy, from which the acceleration factor between test temperature and use temperature is calculated. That factor converts test lifetimes into expected field lifetimes and failure rates.
If more than one failure mechanism is active, the data stop following a single line, so the shape of the plot is also used to check that the mechanism did not change across the test temperatures.
Japanese companies involved
- ESPEC makes temperature and humidity chambers used to run the multi-temperature accelerated tests whose results are analysed with Arrhenius plots.
- ESPEC · Environmental and reliability test chambers
FAQ
How do you get the activation energy from an Arrhenius plot?
Fit a straight line to the natural log of the rate (or of 1/lifetime) against 1/T in kelvin. The slope equals −Ea/kB. Multiply by the Boltzmann constant, 8.617 × 10^-5 eV/K, and change the sign to get Ea in electronvolts.
Why is a wrong activation energy dangerous in reliability work?
The acceleration factor depends exponentially on Ea, so a small error in Ea produces a large error in the predicted field lifetime. An assumed value that is too high makes the test look more accelerated than it is and overstates the product's life, which is why Ea is measured rather than guessed when possible.
Related pages
Sources
Last updated: November 2, 2026